PORTFOLIO ANALYTICS

Turn utilization data
into capital decisions

Improve NOI by identifying underperforming properties, optimizing space allocation, and
making every lease and investment decision with verified data.

Get a demo

Portfolio insights that drive stronger returns

Most portfolio decisions are based on outdated surveys and gut instinct. R-Zero gives you real-time utilization data across every property, so you know exactly where your portfolio is performing and where it isn't.

Every property, every floor, every tenant — in one view. Average and peak utilization updated in real time, filterable across your entire portfolio.
Compare utilization across tenants and spaces to identify who's using what, and where the gaps are.
Utilization trends tied to lease expiry so you're never caught off guard at renewal. Walk in with months of verified data behind you.
Know where to invest, consolidate, or exit before the next budget cycle. Every capital decision backed by real utilization performance.
Energy savings generated by R-Zero offset the cost of your portfolio intelligence.

12 Main Ave

Timezone: US/Central
Building level | 600,000 total sq ft
55%
▲ 7%
Avg Utilization
81%
Peak avg Utilization
Tenant ↑↓ Sq. ft. ↑↓ Average ↑↓ Peak average ↑↓
THE DASHBOARD

Your portfolio, in one place

See how every property actually performs. Track average and peak utilization across every building in your portfolio — filtered by year, tenant, or location.
Spot shifts before they become problems. Month-over-month utilization trends across every property, so you can act on changes before they impact your bottom line.
Measure true space efficiency. Understand how much usable space each occupant is consuming across every location — the clearest signal of over or underutilization.
Never walk into a renewal unprepared. Utilization data mapped directly to lease expiry dates — so every renewal conversation is backed by months of verified performance data.
Plan ahead with confidence. Projected utilization data across your portfolio so you can plan capital expenditures, renewals, and consolidations before the decision is urgent.
Compare across any dimension. Filter and compare utilization by individual tenant, building, or space type — across your entire portfolio in one view.
HOW IT WORKS

One platform, portfolio-wide intelligence

Privacy-first sensors detect presence and count occupants across desks, rooms, floors, and building entrances. All data is processed on-device — nothing sensitive ever leaves the sensor.
The R-Zero Hub aggregates sensor data over BLE and streams it securely to R-Zero's cloud over an authenticated connection.
R-Zero Connect transforms raw occupancy data into portfolio-wide utilization metrics, trends, and forecasts — accessible via dashboard or API.
Use verified utilization data across every property to plan capital expenditures, optimize lease decisions, and improve NOI.

"When I installed the R-Zero sensors in our Dublin office, it couldn’t have gone smoother! I was able to install just under 50 sensors in a matter of a few hours. Everything was meticulously labeled and separated to make the job as easy as possible. I would recommend a self-install for any of our future projects as it worked like a charm!"

Gary Gaughan,
Senior Workplace Strategist, Indeed
Image 2
Image 1
TAKE IT FURTHER

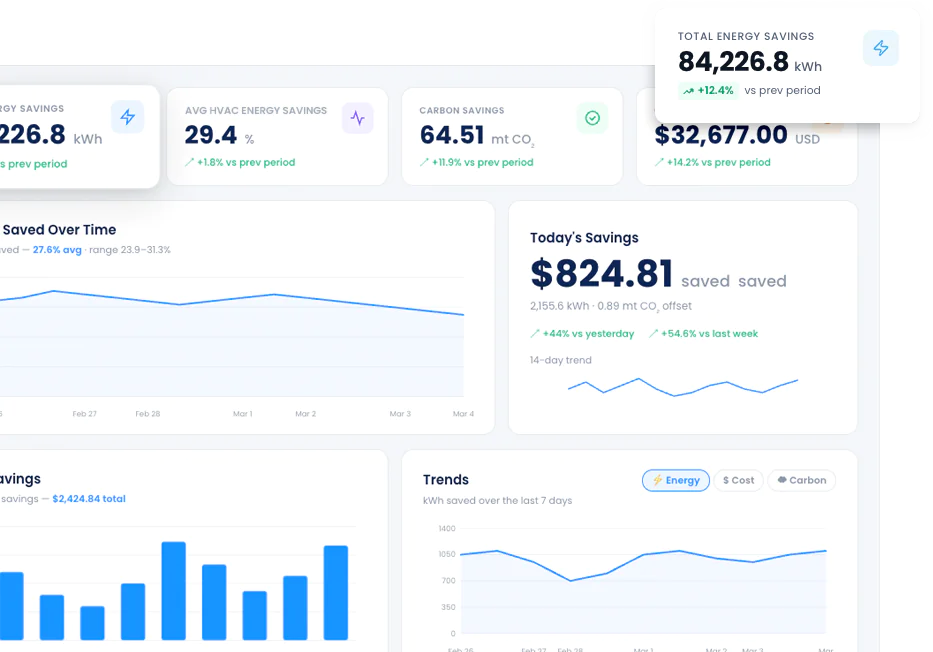
Turn portfolio insights into savings.

Portfolio Analytics shows you where your buildings are underperforming. AI Energy Efficiency acts on it by automatically adjusting airflow based on real-time occupancy so every building in your portfolio runs leaner without lifting a finger.


Learn about AI Energy Efficiency