
WorkPlace Utilization: Discrepancies between CAFM, Badge, & Sensor Data
It’s not uncommon for an organization’s assumed workplace utilization to be vastly different from reality. We’ve found this to be due to several things— a lack of understanding in what utilization represents and the low fidelity of the tools used when measuring. Historic methods for determining utilization are not actually processes of measuring at all but, instead, a series of assumptions that can steer organizations in the wrong direction. More than ever, organizations are moving towards more accurate tools like workplace occupancy sensors for measuring how their workplaces operate.
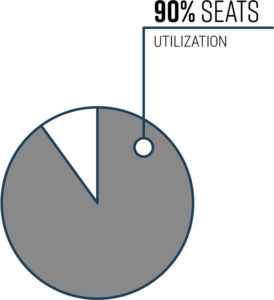
A less accurate, assumptive method of determining workplace utilization revolves around using worker assignments or “seating ratios” that define how seats are assigned to a set number of employees. This allows organizations, for example, Company A, who has 90 assigned desks and 10 unassigned to assume they have a 90% utilization rate. This is a starting point but clearly may be misleading given those 90 desks may not actually be used on a daily basis. At , we wouldn’t even consider this to be a “utilization” metric.
A seating ratio is just a figure that describes asset allocations. We use this workplace data within our occupancy analysis to understand utilization of assets according to how they’re classified, but it only further informs the utilization rate, it does not create it. Space utilization is, by definition, a “rate” of occupancy—a comparison of two variables. In the case of space utilization, we’re comparing occupancy to time. Without the variable of time, utilization can not be accurately measured.
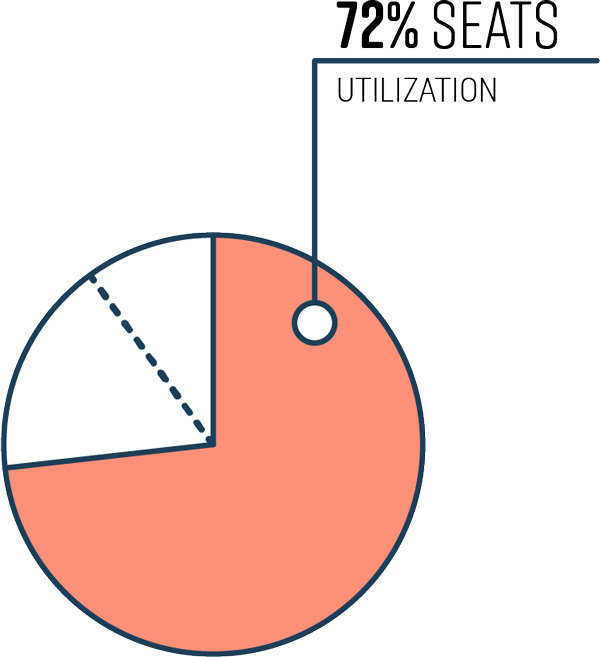
To get closer to the actual utilization, organizations may seek to use a low-res value of time, badge data, to measure against occupancy. For example, Company A may consult badge data for a daily “show-up” rate. If each of the 90 workers only come into the office 4:5 days a week, then the utilization degrades to 72%. This is clearly much lower utilization and closer to the actual value but it still doesn’t tell the whole story. While badge data may record when a person enters a building, it rarely records when they leave. This leaves the utilization data, again, with gaps.
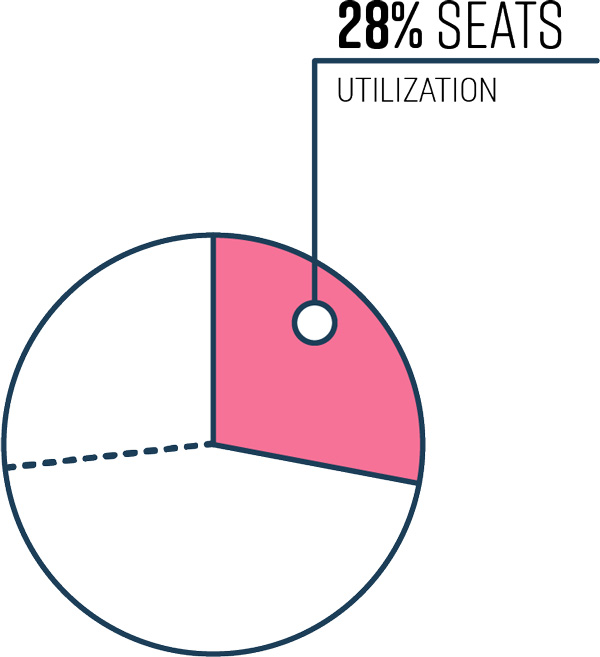
To determine actual utilization, the organization needs to use a high fidelity source for capturing occupancy data, like workplace sensors that measure occupancy over time. While sensors are passive and do not collect personal information like badge data, they still provide the necessary insight into how seats are used throughout the day. For Company A, sensors may reveal, for example, that when your 90 workers are in the office their 4 days of the week, they only spend 40% of their time at their desk. This means desk utilization degrades further to a shocking 28%. It’s with this level of findings that organizations can start making critical workplace decisions.
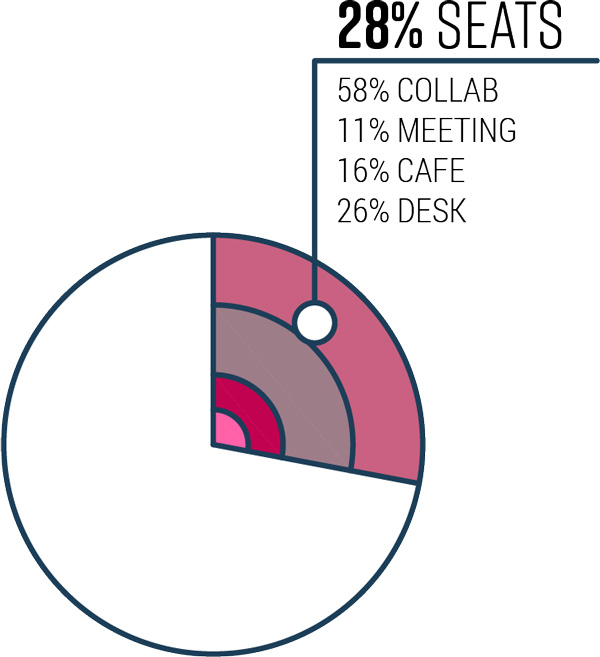
I would advocate that this high level of is just the beginning. These utilization metrics can (and should) be broken down into further sensor-based utilization datagranular detail. Not all seats are treated equally when designing an effective utilization strategy. For example, those seating ratios assigned to locations throughout the workplace vary across different types of work settings. Seats in a conference room may be divided amongst a much larger population of workers than workstations.
As observed in the examples above, and unsurprisingly, workplace utilization directly correlates to the method of collecting occupancy data. For this reason, sensor-based occupancy data collection should always be a baseline requirement for any utilization metrics. As with sensors, a gold standard in the industry, there are many steps beyond capturing a simple utilization metric to bring value to your organization. Utilization, and the high-res occupancy data on which it’s built, leverages itself for many real estate stakeholders such as facilities maintenance and space booking. To find out more, check out our resources page here.
More posts you might like
-

The importance of indoor air quality testing in office buildings
In today’s workplace, ensuring a healthy and productive environment for employees is crucial. One of the most significant factors influencing workplace well-being is indoor air quality (IAQ). As part of our focus on smart buildings, R-Zero offers advanced indoor air quality testing solutions like the R-Zero IAQ Monitor, designed specifically for enhancing occupant comfort and […]
-

What is Smart Cleaning & How Can it Benefit My Healthcare Facility?
Did you miss our recent webinar on how smart cleaning can help optimize healthcare facilities for people, energy, and sustainability? During the webinar, our healthcare experts covered insights and case studies exploring how data-driven strategies are enhancing hospital cleaning protocols, resulting in optimized EVS staff productivity, faster patient room turnaround, and more effective cleaning of […]
-

The Value of Improving Indoor Air Quality in Buildings
Understanding and improving indoor air quality is important because it ensures your indoor spaces are providing adequate ventilation and keeping building tenants comfortable, productive, and healthy. Indoor air quality monitoring is also a strategic tool that can help you reduce unnecessary energy costs tied to overrunning your HVAC systems to increase ventilation in your spaces. […]